Inspect Execution Result
To view execution results of one or more data processes.
Execution Metadata and ID
Each execution has an unique ID (regardless of its execution status) which can be used for searching. The ID can be found from the response returned by a trigger or can be copied directly from a manual execution result.
The following is an example of a JSON body of an API route response:
{
    "_status": 200,
    "_metadata": {
        "executionId": "Y9oAGowUL-ALdKY7i6aljg",
        "triggerType": "ApiRoute",
        "triggerId": "00000000-0000-0000-0000-000000000000",
        "creationTimestamp": "2024-01-01T00:00:00.000000Z",
        "completionTimestamp": "2024-01-01T00:01:00.000000Z",
        "status": "Complete"
    },
    "data": {
        // combined task results
    }
}
An asynchronous API route still returns execution and trigger metadata but will not wait for task results.
Only API routes will have the _status field, which can be configured using the result agent of the SDK. (Be noted that the _status field will always be 20x in manual executions.)
For API routes, the execution and trigger metadata can be omitted (only return task results if any) by setting encapsulation to false.
For manual execution results in Studio, the execution ID will also show up in the execution result window:
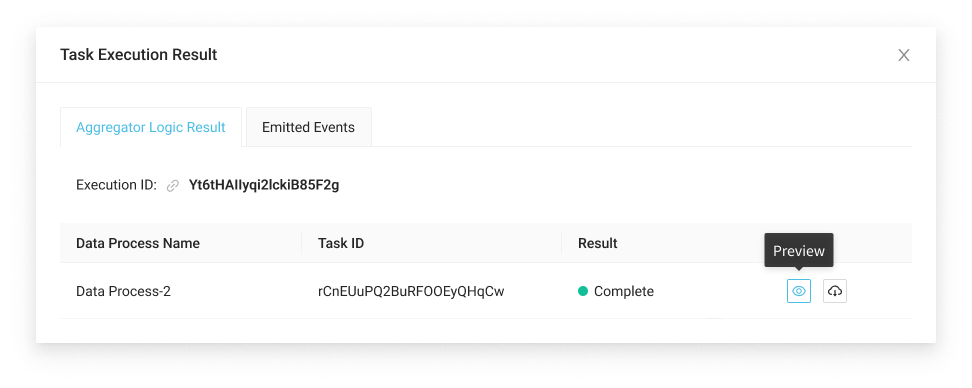
A manual execution result only contains the task result and the overall execution status.
You can inspect the full execution result in the execution result section.
Execution Status
For each execution or task comes with an execution status:
● Complete | An execution, task or logic had completed execution without errors or timeout. |
● In Progress | An execution is still running due to execution of one of the task or logic has not yet completed and timeout hasn't been reached. |
● Timeout | Execution time of one of the task had exceeded the data process' timeout limit (default: 180 seconds). |
● Execution Error | For an execution, it indicates one of the task had reported
|
● Complete with Error |
|
● System Error |
|
● Not Execute | Logic had skipped execution due to one previous logic in the task
had reported |
Inspect an Execution Result
A full execution result includes metadata of the execution, its tasks as well as logs from each task.
- LOC Studio
- In LOC Studio, go to Data Discovery ➞ Execution History.
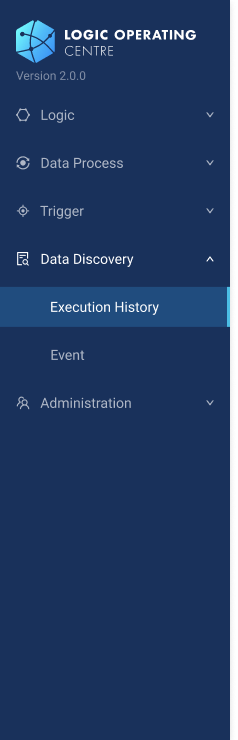
- Click on the trigger name of an execution result you are looking for.
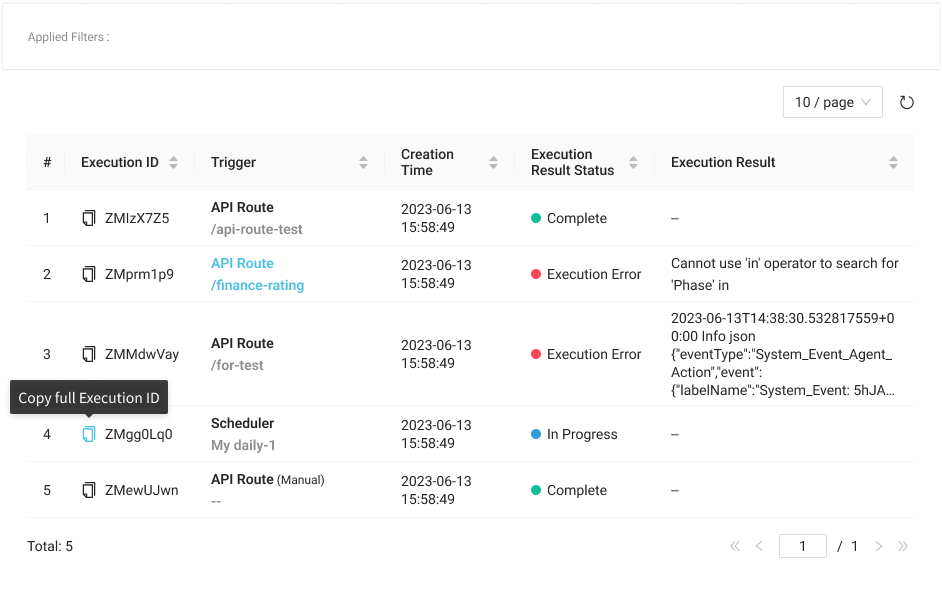
- The execution result contains metadata of the trigger and all of its tasks. You can copy
 PIDs or preview
  the execution trigger payload (if any), execution result or one of the task results.
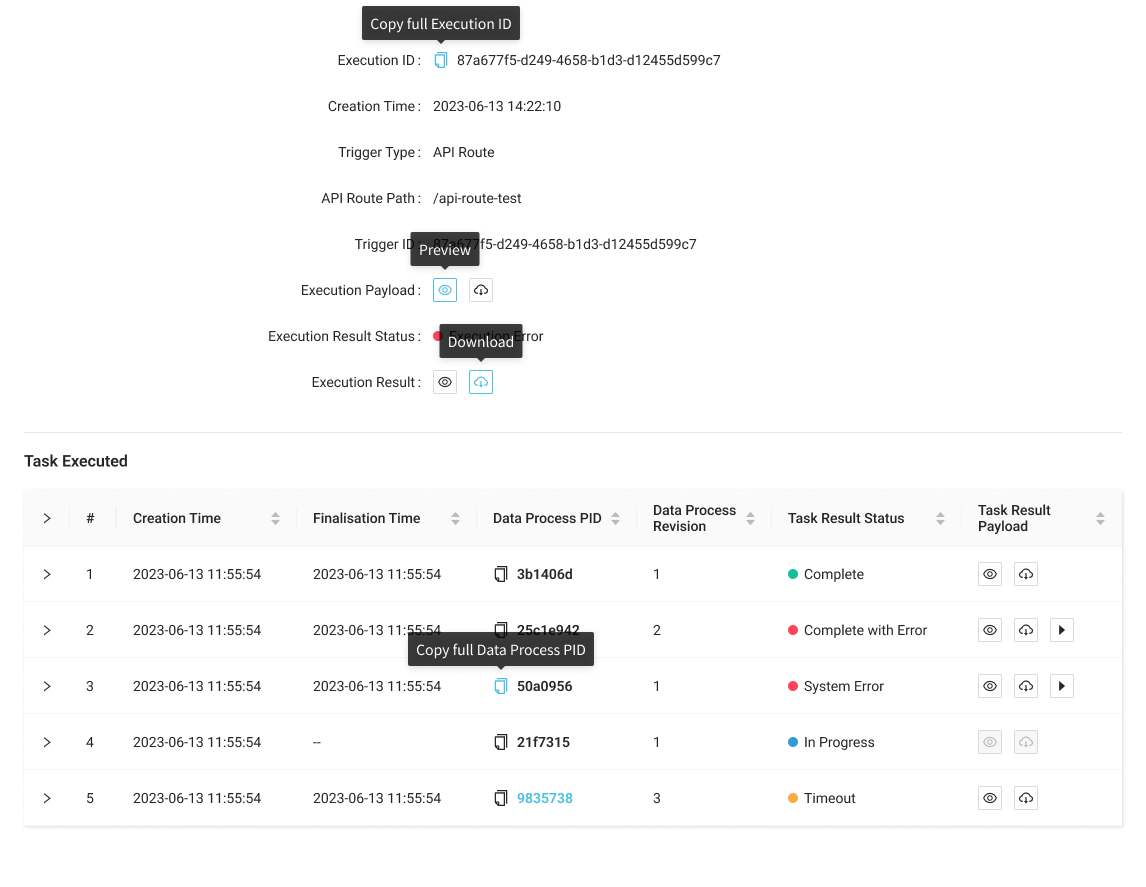
- Click the right arrow
 of a task to expand its logic.
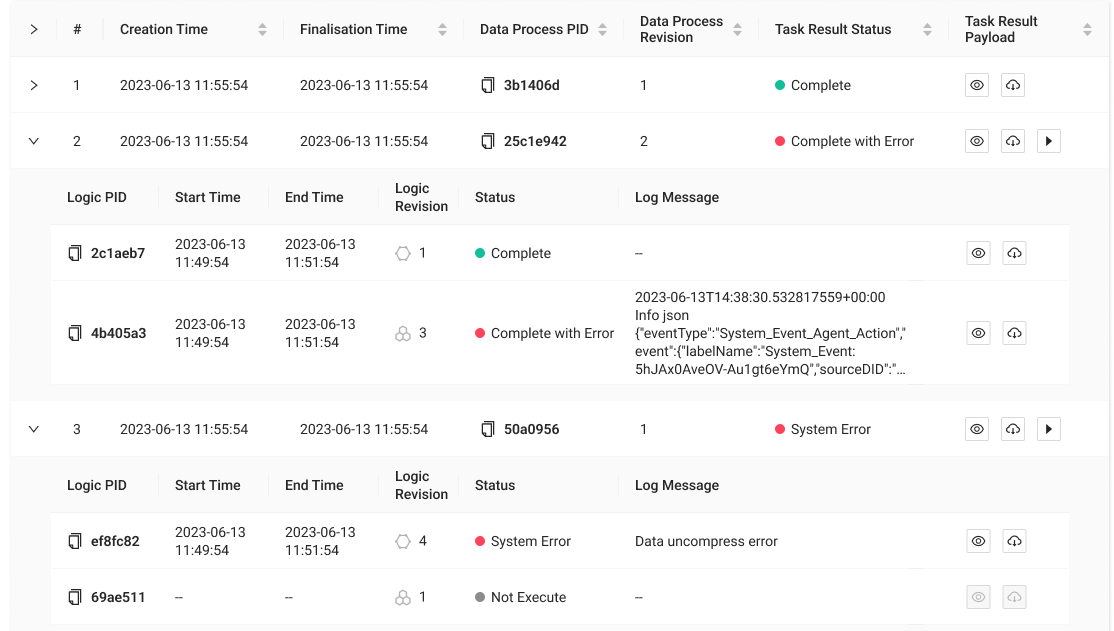
- By default, only the first log (if any) will be displayed. Click Preview behind a logic to inspect the full logs.
Logs can be written using the logging agent of the SDK. See: Logging Agent.
You can also click on a data process PID (permanent ID) to inspect the data process, or click on a logic PID to inspect its source code snapshot.
Re-Execute a Task
- LOC Studio
If a task of an execution failed to complete due to some error, an Re-execute  button will show up to allow you to manually execute the data process again.