Create and Use an API Route Trigger
See Quick Start for how to deploy the necessary logic and data process for this tutorial.
In LOC, a trigger can be used to invoke one or more data processes. The most common form of it is API route, which is in fact user-defined HTTP endpoints.
Here we'll see how to add one API route for our "Hello World" data process demostrated in Quick Start. The API route would work as follows:
Create an API Route
Go to API Route panel, right click on your project to create an API route:
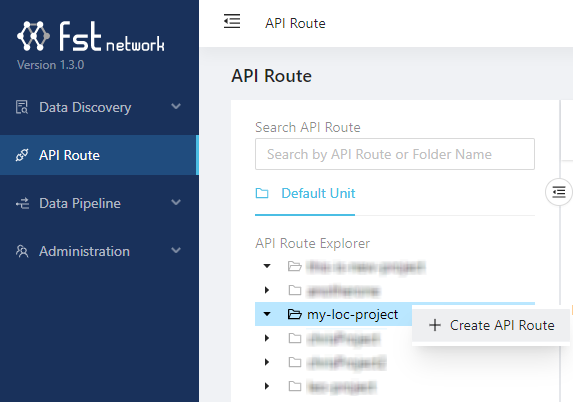
If you know have a project, create one in the Data Pipeline/Data Process/Explorer panel.
Give the API route a name (for example, hello-world-api) and set it to accept HTTP POST requests. Click Linked Data Processes and find your deployed data process:
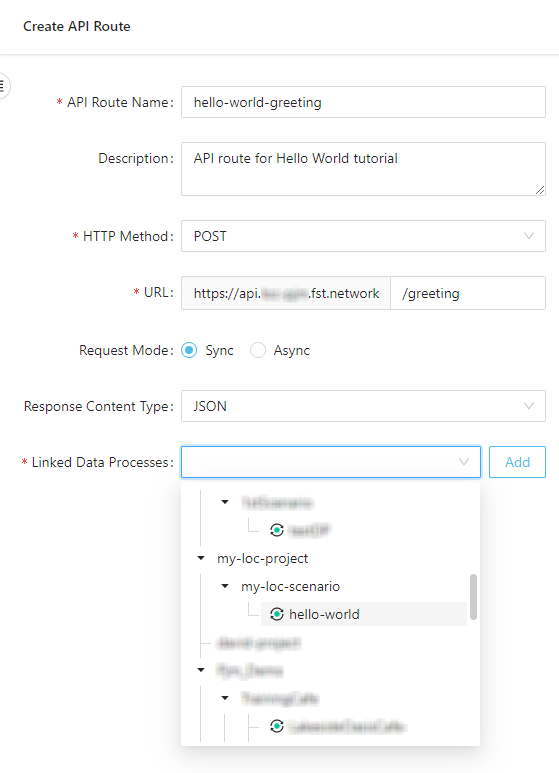
Click Add to add the data process:

Then click Create:
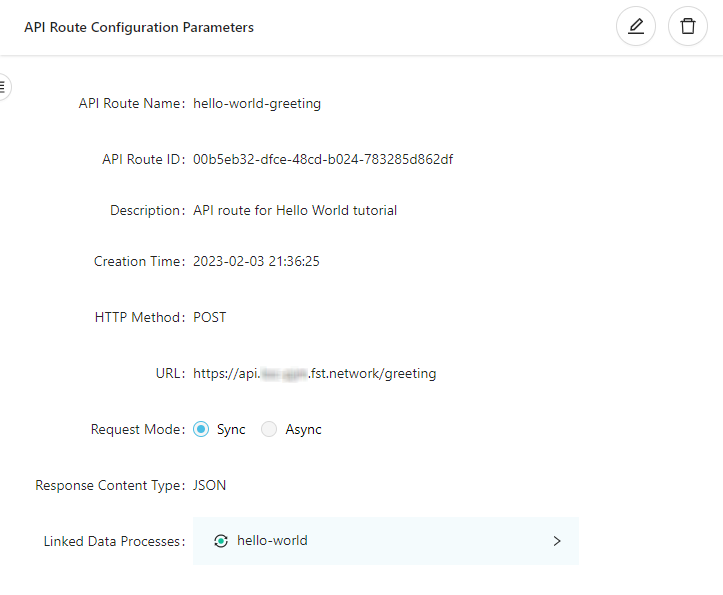
Copy the URL in the API route (in the example it's https://api.xxxxxx.fst.network/greetings). This is the HTTP endpoint available for invoking the "Hello World" data process.
The list of data processes to be invoked by a trigger is also referred as the trigger manifest. If there are more than one data process linked, they will be executed simultaneously.
If a linked data process is modified, it'll have to be manually re-link to the trigger (by removing and adding it again) to be invoked properly again.
Invoke a Data Process with API Route
You can use any HTTP client (for example, the free and web-based Hoppscotch) to send a HTTP POST request:
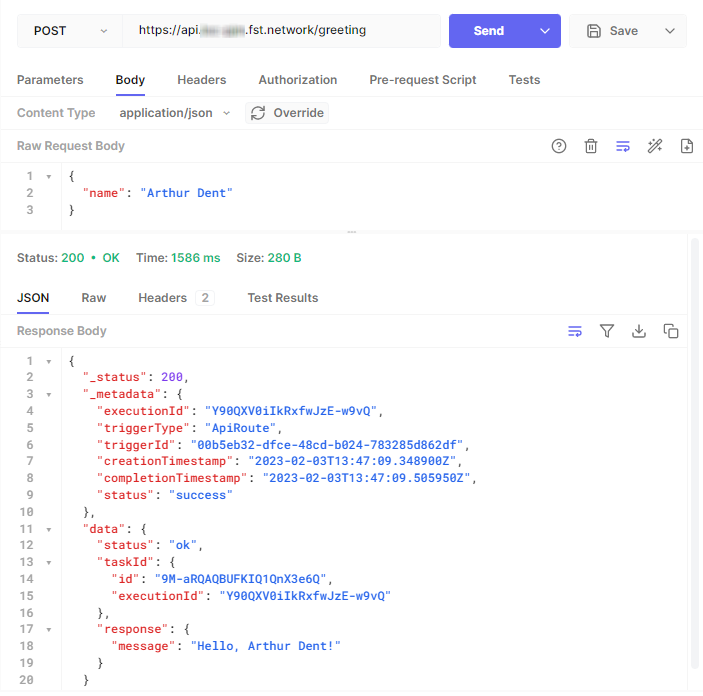
Make sure you have set the HTTP request type (POST) and body (Content type application/json with the JSON payload present).
The API route should always return a 200 reesponse even though an error had occurred in the data process.
-
If you receive a
404response, it can be that LOC Core is still deploying the API route. Wait a dozen seconds then try again. -
If you receive a
202response, it could be one of the reasons below:
- The response has exceeded the default limit of 15 seconds (timed out).
- You set the API route as asynchronous by mistake so LOC did not wait for the execution result.
- Something is wrong with LOC runtime to execute data processes properly.
If you have encounter multiple execution failure in LOC, please contact your team or give us a call if needed.
Linux and macOS users can also use curl:
curl -X POST -d '{
    "name": "Arthur Dent"
}' -v -i 'https://api.xxxxxx.fst.network/greetings'
In our example the API route responses with a JSON payload as below:
{
    "_status": 200,
    "_metadata": {
        "executionId": "Y90QXV0iIkRxfwJzE-w9vQ",
        "triggerType": "ApiRoute",
        "triggerId": "00b5eb32-dfce-48cd-b024-783285d862df",
        "creationTimestamp": "2023-02-03T13:47:09.348900Z",
        "completionTimestamp": "2023-02-03T13:47:09.505950Z",
        "status": "success"
    },
    "data": {
        "status": "ok",
        "taskId": {
            "id": "9M-aRQAQBUFKIQ1QnX3e6Q",
            "executionId": "Y90QXV0iIkRxfwJzE-w9vQ"
        },
        "response": {
            "message": "Hello, Arthur Dent!"
        }
    }
}
This is more detailed than the task result we've seen in Quick Start, because this is the execution result which contains the sole task result. If we have triggered multiple data processes with an API route, all of the task results will be included.
Data processes linked in the same trigger will be invoked simultaneously.
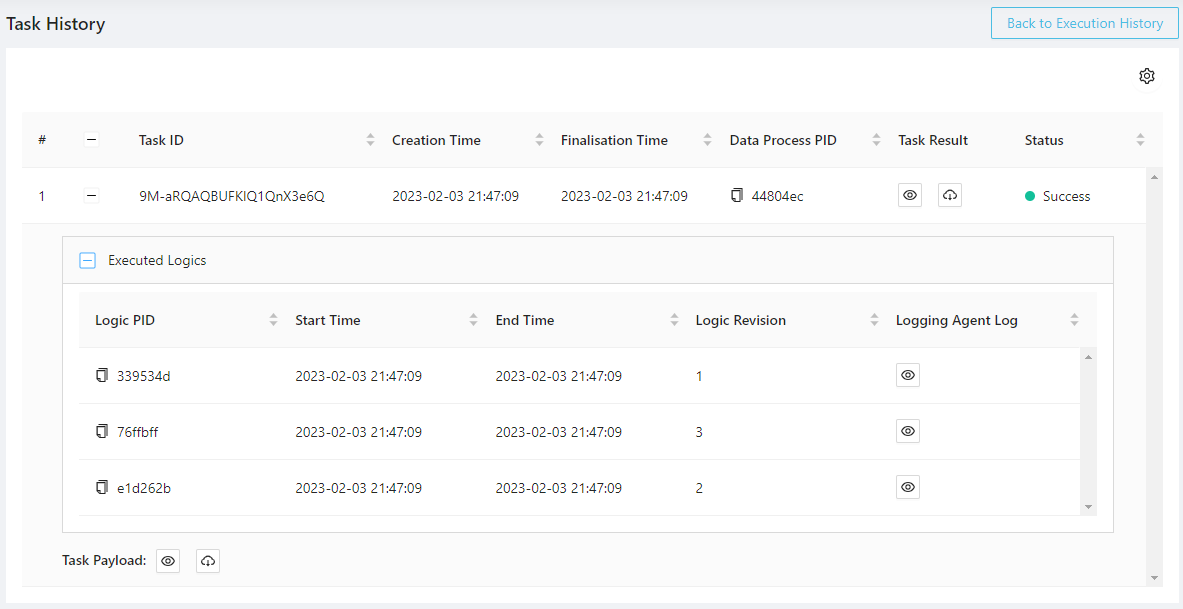
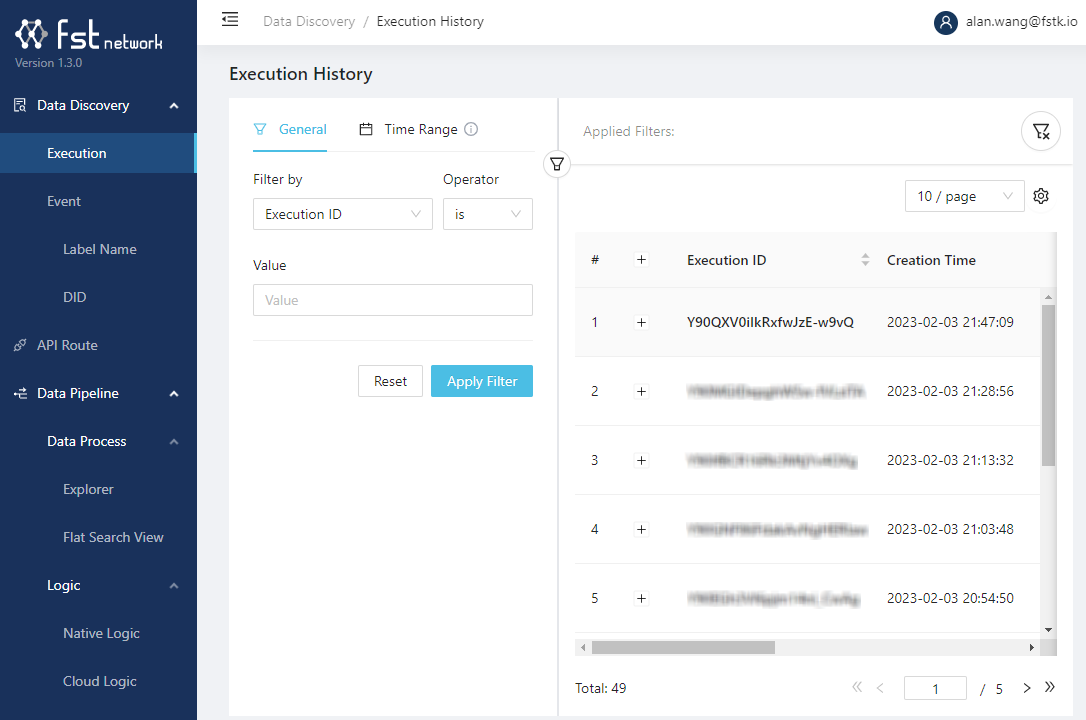
View Execution History
In LOC, any action of invoking data processes with triggers would be preserved as execution histories which you can query later.
An execution history contains the following information:
- Task ID
- Execution ID
- Execution timestamps and status
- Trigger ID
- Executed data process and logic PIDs
- Logic logging message (outputed with Logging Agent)
- Trigger payload and result
Go to Data Discovery/Execution and find the entry with the correct execution ID:
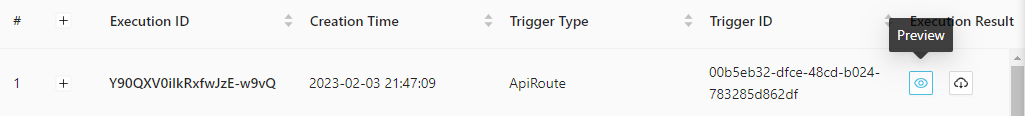
Executions triggered with simple data process execution would use a mocked API route which have all-zero IDs.
Click the "Preview" button on the right to inspect the execution result:
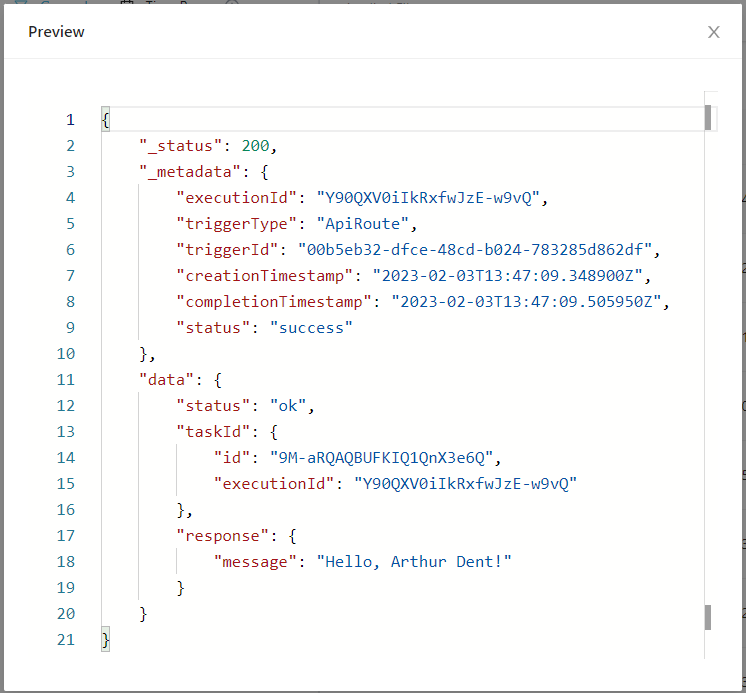
This is the same result we've received in the HTTP client.
You can also inspect more detailed logic execution/logging history by clicking on the execution ID and expend its content: