Using Local Simple Runtime
Local Simple Runtime is a Docker-based LOC local developing environment. It offers the following benefits:
- Does not require login nor any cloud resources
- Supports session storage, local storage and event store
- Supports all agents
- Possible to read log messages and use local database/file services (except SMB)
A developer can first develop and test a data process in the local simple runtime (often referred as local runtime in this docs), before moving to production deployment.
Prerequisites
You need to install Docker Desktop or Docker engine and Docker Compose. See Setup CLI.
Create and Setup Local Profile
Create a profile /profiles/local-profile.yaml at the root of your CLI workspace:
simpleRuntime:
    image: public.ecr.aws/m0s8j1u6/saffron/simple-runtime:0.7.0
    dockerNetwork: host
    eventstoreEndpoint: http://127.0.0.1:8087
    etcdEndpoints: http://127.0.0.1:2379
And set it as your default profile:
./loc profile set -f ./profiles/local-profile.yaml -p local
./loc profile use local
Install and Start Local Service
Pull Data Process Image
If you are using this version of local simple runtime for the first time, open a terminal and pull the data process image:
docker pull public.ecr.aws/m0s8j1u6/saffron/simple-runtime:0.7.0
This is the actual loca runtime itself, but we need a few services to make it work.
Create Docker Compose File
Create a new file /local-runtime/docker-compose.yaml in CLI workspace with the following content:
version: "3.9"

networks:
    saffron:
        driver: bridge

volumes:
    es01:
        driver: local

services:
    saffron-evenstore:
        restart: "always"
        image: public.ecr.aws/m0s8j1u6/saffron/eventstore:0.7.0
        container_name: saffron-evenstore
        ports:
            - "8200:8200"
            - "8087:8087"
            - "8007:8007"
        environment:
            - SAFFRON_EVENTSTORE_API_ASSRESS=0.0.0.0
            - SAFFRON_EVENTSTORE_API_PORT=8007
            - SAFFRON_EVENTSTORE_AUTHORIZATION_SECRET=-----BEGIN PUBLIC KEY-----MIIBIjANBgkqhkiG9w0BAQEFAAOCAQ8AMIIBCgKCAQEAmuzhqHVUKj0CVtnqCS1PbVOyq1TcyykKgXoBwQvPaF8N8zIHXUjCgwjmKbOK+SjLoLC7cgLWlwbV2u12J/9w2sTawbROOno7Td2OZte2qNLugsEf5RxGVKd4IZx5zshxTI/bwnYGvpyVWdbRGvtWMKpbkzkR7O8UumtUMdUl6h1iUKRXkAxoB2ge/CZUDCss643iS0KPO7gIowvcYFCKBX86G/+GBlIHcXWTIa2eEWuTx5T64lmSVJrlN1L6diZRlUIBq6JNuQv26ZJgNAO91DDcCLCxcQgLH5KqwzdXwz2jBOqL7ac1HAW/mov4oJrk7ytWVumoFJ+NlJlSZ+vd5wIDAQAB-----END PUBLIC KEY-----
            - SAFFRON_EVENTSTORE_GRPC_ADDRESS=0.0.0.0
            - SAFFRON_EVENTSTORE_GRPC_PORT=8087
            - SAFFRON_EVENTSTORE_METRICS_ADDRESS=0.0.0.0
            - SAFFRON_EVENTSTORE_METRICS_PORT=8200
            - SAFFRON_EVENTSTORE_ELASTICSEARCH_ENDPOINT=http://es01:9200
            - SAFFRON_EVENTSTORE_ELASTICSEARCH_USERNAME=
            - SAFFRON_EVENTSTORE_ELASTICSEARCH_PASSWORD=
        command:
            - run
        networks:
            - saffron
        depends_on:
            - etcd01
            - es01

    es01:
        image: docker.elastic.co/elasticsearch/elasticsearch:7.16.1
        restart: "always"
        container_name: es01
        environment:
            - xpack.security.enabled=false
            - bootstrap.memory_lock=true
            - discovery.type=single-node
            - "ES_JAVA_OPTS=-Xms512m -Xmx512m"
        ulimits:
            memlock:
                soft: -1
                hard: -1
        volumes:
            - es01:/usr/share/elasticsearch/data
        ports:
            - "9200:9200"
        networks:
            - saffron

    kibana:
        image: kibana:7.16.1
        restart: "always"
        container_name: kibana
        volumes:
            - ./kibana.yaml:/usr/share/kibana/config/kibana.yml
        ports:
            - "5601:5601"
        networks:
            - saffron

    etcd01:
        image: docker.io/bitnami/etcd:3.5.1-debian-10-r31
        restart: "always"
        container_name: etcd01
        environment:
            - ALLOW_NONE_AUTHENTICATION=yes
            - ETCD_NAME=etcd01
            - ETCD_INITIAL_ADVERTISE_PEER_URLS=http://etcd01:2380
            - ETCD_LISTEN_PEER_URLS=http://0.0.0.0:2380
            - ETCD_LISTEN_CLIENT_URLS=http://0.0.0.0:2379
            - ETCD_ADVERTISE_CLIENT_URLS=http://etcd01:2379
            - ETCD_INITIAL_CLUSTER_TOKEN=saffron-etcd-cluster
            - ETCD_INITIAL_CLUSTER_STATE=new
        ports:
            - "2379:2379"
        networks:
            - saffron
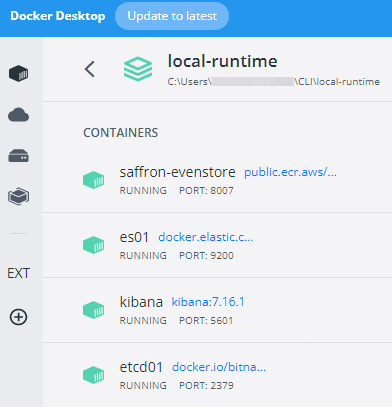
This file defines four containers:
- etcd for local storage
- LOC Event store
- Elasticsearch for event store
- A Kibana web interface for Elasticsearch
Create Kibana Configuration File
Create a /local-runtime/kibana.yaml in the CLI workspace:
server.name: "kibana"
server.host: "0.0.0.0"
elasticsearch.hosts: [http://es01:9200]
xpack.security.enabled: true
elasticsearch.username: "elastic"
elasticsearch.password: "aa123456"
monitoring.enabled: false
Create Preset Task File
Create a run-local-task.yaml in the CLI workspace:
./loc dp run-init
Then choose Local (for 'loc dataprocess run-local'):
tasks:
    - dataProcess:
          permanentIdentity: 00000000-0000-0000-0000-000000000000
          revision: 1
      taskKey:
          executionId: AAAAAAAAAAAAAAAAAAAAAA
          taskId: AAAAAAAAAAAAAAAAAAAAAA
      payload:
          http:
              apiGatewayIdentityContext:
                  id: 00000000-0000-0000-0000-000000000000
                  name: ""
              apiRouteIdentityContext:
                  id: 00000000-0000-0000-0000-000000000000
                  name: ""
              requestId: "5566"
              request:
                  scheme: https
                  method: POST
                  path: /loc/example
                  query: "client=cli"
                  version: HTTP/1.1
                  headers:
                      Content-Type: application/json
                  host: fst.network
                  data:
                      body: Hello, World!
agentConfigurations:
    # ...
A minor incompatibility in Core v0.7.0 requires slightly different way to access taskId and executionId (which had been patched in v0.7.1 but not yet for the local simple runtime):
const taskId = ctx.task.taskKey.taskId;
const executionId = ctx.task.taskKey.executionId;
The local runtime will be fixed as well in LOC v0.8.0 release.
Modify it as you like, for example, adding simulated query string and/or JSON body:
# ...
query: "?name=Arthur-Dent&age=42"
# ...
data:
    name: "Arthur Dent"
    age: 42
This is similar to the task file in Simple Data Process Execution, however the two are a bit different. We will need this file to make it work.
Setting Up Agent Configurations
The last section of run-local-task.yaml simulates agent configurations for HTTP, database, file storage and mail agents:
- Empty config
- Example config
# ...
agentConfigurations:
    database: []
    fileStorage: []
    http: []
    mail: []
# ...
agentConfigurations:
    database:
        - name: dummy-mssql
          type: MSSQL
          host: 0.0.0.0
          port: 1433
          database: database
          username: username
          password: password
          trustCert: true
          instanceName: ""
          maxConnectionCount: 10
        - name: dummy-mysql
          type: MySQL
          host: 0.0.0.0
          port: 3306
          database: database
          username: username
          password: password
          maxConnectionCount: 10
        - name: dummy-oracle
          type: Oracle
          host: 0.0.0.0
          port: 1521
          serviceName: serviceName
          username: username
          password: password
          integratedSecurity: true
          extraParams: {}
          maxConnectionCount: 10
        - name: dummy-postgres
          type: Postgres
          host: 0.0.0.0
          port: 5432
          database: database
          username: username
          password: password
          options: ""
          maxConnectionCount: 10
    http:
        - host: https://google.com
          port: 443
          scheme: Https
          pathPrefix: ""
          name: dummy-http
          headers:
              - name: X-Agent-Configuration
                value: SimpleRuntime
    fileStorage:
        - name: dummy-s3
          endpoint:
              host: 0.0.0.0
              port: 443
              scheme: Https
          bucket: bucket
          accessKey: accessKey
          secretAccessKey: secretAccessKey
          region: ""
          pathPrefix: ""
          type: S3
        - name: dummy-ftp
          host: 0.0.0.0
          port: 21
          username: username
          password: password
          pathPrefix: ""
          type: FTP
        - name: dummy-file
          pathPrefix: ""
          type: File
    mail:
        - name: dummy-smtp
          host: 0.0.0.0
          username: username
          password: password
          port: 0
          protocol: SMTP
This is the default content generated by CLI. Each of the configuration groups can have multiple subitems and each should have an unique name.
Start Local Service
Make sure your Docker is up and running, then run the following command from the CLI workspace:
docker-compose -f ./local-runtime/docker-compose.yaml up -d
Wait a bit for the event store can be initialized properly.
These services will automatically start every time you restart your machine.
You can stop the services with
docker-compose -f ./local-runtime/docker-compose.yaml down
Execute a Data Process
- JavaScript
- TypeScript
./loc dp run-local <project name> -f run-local-task.yaml --docker
./loc dp run-local -ts <project name> -f run-local-task.yaml --docker
CLI will start up a new data process container, print out logs and return any data from the result agent.
For example, if we use the example from Quick Start, you will see a log in the output like this:
Build Generic Logic...
 ████████████████████████████████████████ 100% | ETA: 0s | 1/1
Build Aggreator Logic...
Generic Data Process Config File...

Run Simple Runtime
...
2022-10-31T02:33:00.767282806+00:00     Info    json    {"parsed_json":{"name":"Arthur Dent"}}
...
2022-10-31T02:33:00.792045Z  INFO saffron_runtime_server::task_finalizer::logging: Final result of Data Process [permanent identity=00000000-0000-0000-0000-000000000000,revision=1] task [execution_id=AAAAAAAAAAAAAAAAAAAAAA,task_id=AAAAAAAAAAAAAAAAAAAAAA]:
{"status":"ok","response":{"message":"Hello, Arthur Dent!"}}
Logging agent logs will appear at the beginning of the local simple runtime logs.
Purge Runtime Containers
Since every local data process execution creates a new container, you can clean up unused assets with this command:
docker rm $(docker ps -a -q --filter ancestor=public.ecr.aws/m0s8j1u6/saffron/simple-runtime:0.7.0)
This command does not work in Windows' Command Prompt; please use PowerShell instead. Or you can manually delete all non-active containers in Docker Desktop.
Accessing Localhost Services
HTTP, database and file storage agents alike can access your localhost services via
host.docker.internal:<port>
For example, ftp://user:pass@host.docker.internal:21/path/filename.
Accessing Local Event Logs
The local runtime comes with a Kibana service, just like the real LOC Core environment, which enables us to see event logs emitted by event agent without using data processes.
- Open http://127.0.0.1:5601 in your browser. (It will be ready only after the event store is up and running.)
- Go to the left-side menu, go to Analytics -> Discover.
- If this is the first time you use the local Kibana on your machine, click Create index pattern.
- Enter
system_searchin the search box and select timestamp in Timestamp field. - Click Create index pattern again.
- Now go back to Discover. You should able to see event logs now (if there is any).
Below is an example of viewing events in Kibana:
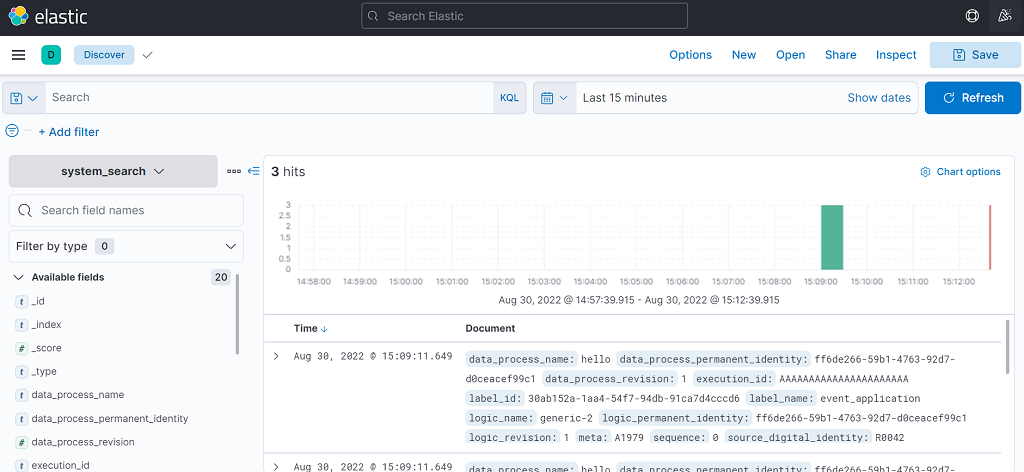
The default display time range is 15 minutes.